
Back to Case Studies
How Sonic Brush Increased Revenue per Visitor by 24% With a New Product Page
3 min. read
Sonic Brush sent Google Ads traffic to the product page for its automatic toothbrush. Agency partner Shivook rebuilt that page to bring the reasons to buy closer to the buy button. The new page earned $2.59 per visitor, up from $2.09, a 24.26% lift in revenue per visitor at 98.65% confidence.
About the Customer
Sonic Brush sells the Sonic Brush V5, a U-shaped automatic toothbrush that cleans all teeth at once in 30 seconds. The brand worked with Shivook, a CRO agency for Shopify and DTC brands that measures every page it builds by revenue per visitor (RPV). Shivook built the new page; ABConvert measured the test.
The Challenge
An unfamiliar product has more explaining to do. Shoppers arriving from an ad need to understand what the brush is, how it fits into a daily routine and what they get, before they're ready to pay.
The Control page led with a large product image beside the price and purchase controls. Most of the explanation sat further down, below the buy button. The question: would a page that answers those questions earlier earn more from each visit?
The Approach
Shivook rebuilt the product page around the buying decision:
- A benefit list in the first screen, beside the product, so shoppers see what the brush does before they scroll.
- A customer review next to the gallery, putting social proof where shoppers look first.
- Purchase options grouped with reassurance, with payment and product details near the buy controls.
The test compared the two complete product pages. It shows which experience earned more, not which single change produced the lift.
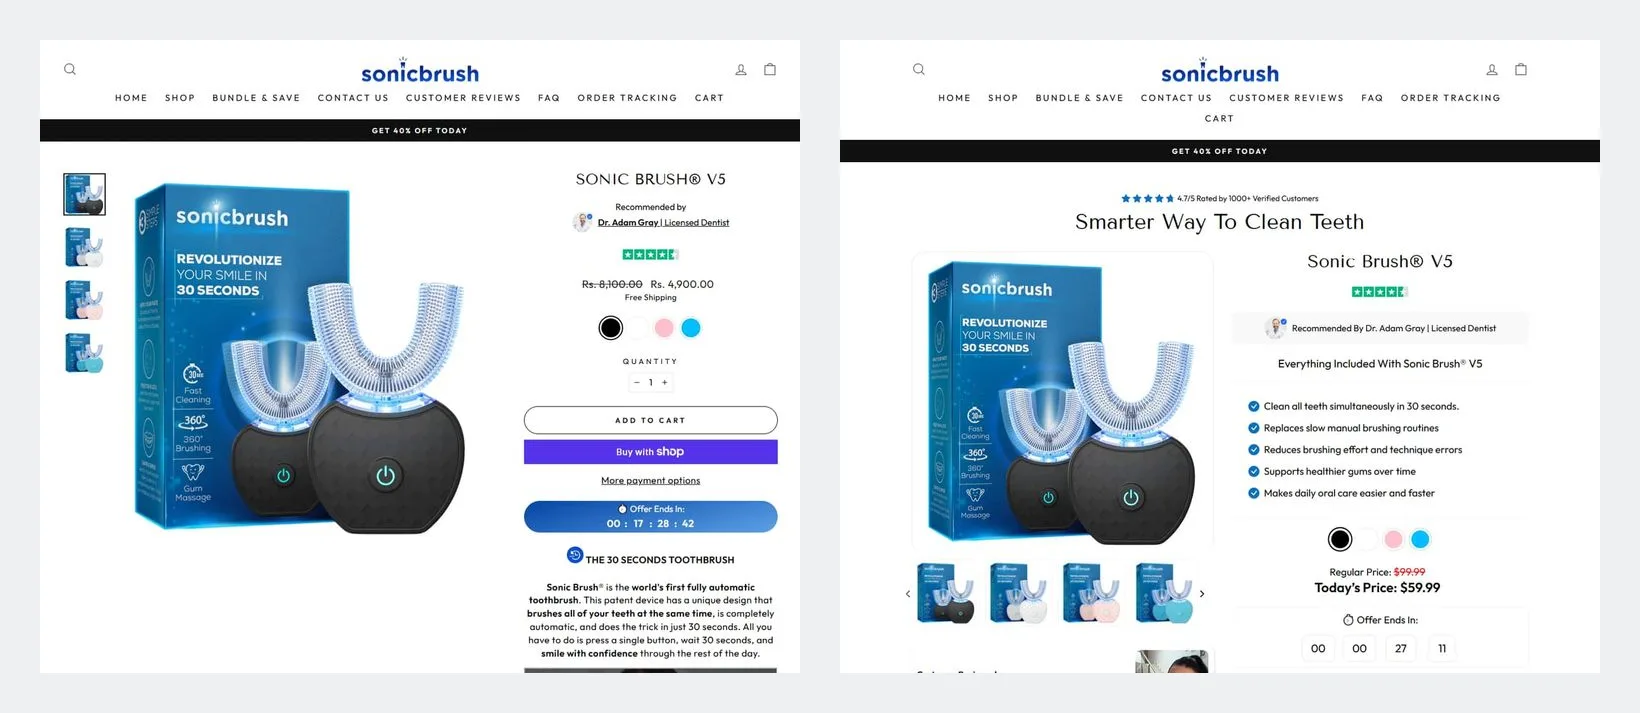
Left: the Control product page. Right: Shivook's product page.
Results
ABConvert measured the test from March 26 to June 18, 2026.
| Metric | Control | Shivook page | Change |
|---|---|---|---|
| Visitors | 10,538 | 8,543 | - |
| Revenue per visitor | $2.09 | $2.59 | +24.26% (98.65% confidence) |
| Order rate | 2.69% | 2.90% | +0.21 pts |
| Average order value | $77.69 | $89.31 | +15.0% |
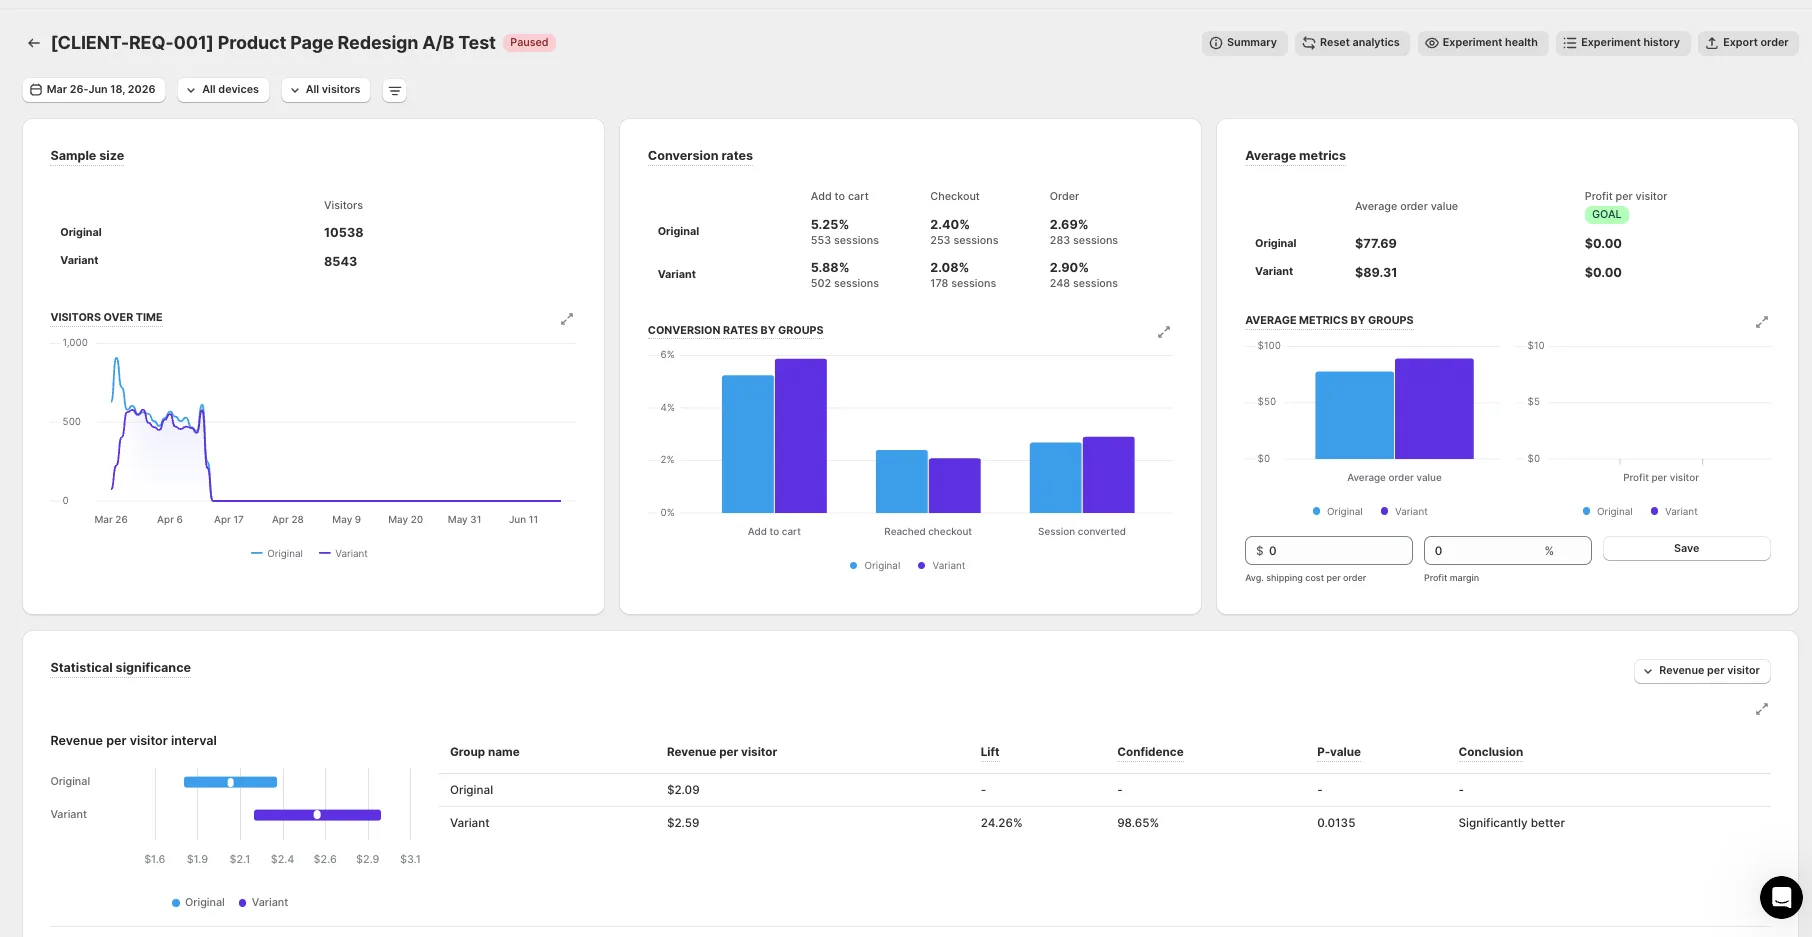
Most of the gain came from order value. Shoppers on Shivook's page converted slightly more often, but they also spent more per order: $89.31 against $77.69. Revenue per visitor captures both, which is why it's the number Shivook optimizes for.
What Other Merchants Can Learn
- Put the reasons to buy next to the buy button. If your product needs explaining, don't make shoppers scroll past the price to find out why it's worth it.
- Watch order value, not just conversion rate. A page that persuades shoppers to choose a bigger option can lift revenue even when conversion barely moves.
- Measure revenue across every visitor. RPV includes the people who didn't buy, so it tells you what each ad click is worth.
For more on how Shivook approaches page tests, read how to prepare a landing page before scaling paid traffic. To find an agency that builds and tests pages like this, see our partner directory.
Test Your Own Product Page
Compare the page shoppers use now with a meaningful alternative, and measure revenue per visitor before deciding which one deserves your traffic.
Another great case study from us