


Which tools are best for conducting a CRO audit?
Discover the best CRO audit tools to identify conversion gaps, analyze shopper behavior, prioritize tests, and improve your store’s conversion rate.
To run a CRO audit, ecommerce teams use Google Analytics 4 (GA4) and Shopify Analytics for conversion trends, Heatmap.com, Hotjar, Microsoft Clarity, or Lucky Orange for on-page behavior, PostHog for event-based funnels and user journeys, and ABConvert to test and validate changes across the buying journey.
This guide lists eight CRO audit tools, their key capabilities, limitations, pricing, and the role they play in your audit workflow.
01What should you look for in a CRO audit tool?
A useful ecommerce conversion rate optimization (CRO) audit tool should help you identify where shoppers drop off, investigate what causes friction, and validate changes against your store’s performance data.
Look for the following capabilities when assessing different CRO tools for ecommerce:
- Funnel and conversion analytics: Track how shoppers move from landing pages to product pages, cart, and checkout. Identify the touchpoints with the largest drop-offs and investigate why conversions decline.
- Heatmaps and session recordings: See where shoppers click, how far they scroll, and how they interact with page elements. Review sessions on underperforming pages to identify navigation issues or overlooked calls to action.
- On-page surveys and customer feedback: Collect direct feedback about purchase hesitation, product concerns, and checkout difficulties. Use responses to investigate issues that behavioral data alone may not explain.
- Technical performance and usability diagnostics: Check page speed, mobile usability, broken elements, and checkout errors. Test high-traffic pages on mobile and desktop to identify technical issues that interrupt purchases.
- A/B testing and experimentation: Test changes to product pages, pricing, shipping offers, and checkout experiences. Measure the impact on conversions before rolling changes out across your store.
- Ecommerce-specific reporting: Track average order value (AOV), revenue per visitor (RPV), and conversion rate alongside each other. Check whether a change increases revenue and order value while protecting your margins.
02Best conversion rate optimization tools for conducting a CRO audit
The best CRO audit tools help you investigate specific conversion problems, from funnel drop-offs and on-page friction to user journeys and experiment results.
Your choice depends on the insights you need from your store data.
| Tool | Best for | Key insights | Main limitation |
|---|---|---|---|
| Shopify Analytics | Store performance | Sales, conversion, AOV | Limited insight into on-page shopper behavior |
| Heatmap.com | Ecommerce behavior | On-page interactions and revenue insights | Insights depend on supported tracking and reporting |
| Hotjar | Behavioral research | Heatmaps, session recordings, customer feedback | Requires ecommerce analytics to assess revenue impact |
| Microsoft Clarity | Behavioral analysis | Heatmaps, session recordings, behavioral signals | Doesn't independently explain the business impact of observed behavior |
| Lucky Orange | On-site behavior | Dynamic heatmaps, recordings, engagement | Behavioral insights may overlap with other tools in your stack |
| Google Analytics 4 | Funnel analysis | Traffic sources, events, conversion paths | Identifies drop-offs but doesn't inherently explain their causes |
| PostHog | Event-based analysis | Funnels, user paths, session replay | Requires relevant events to be instrumented |
| ABConvert | Experimentation | A/B test results across the buying journey | Requires a clear hypothesis and suitable experiment to validate proposed changes |
Let’s dive into each tool in detail.
Shopify Analytics: Best for store performance insights
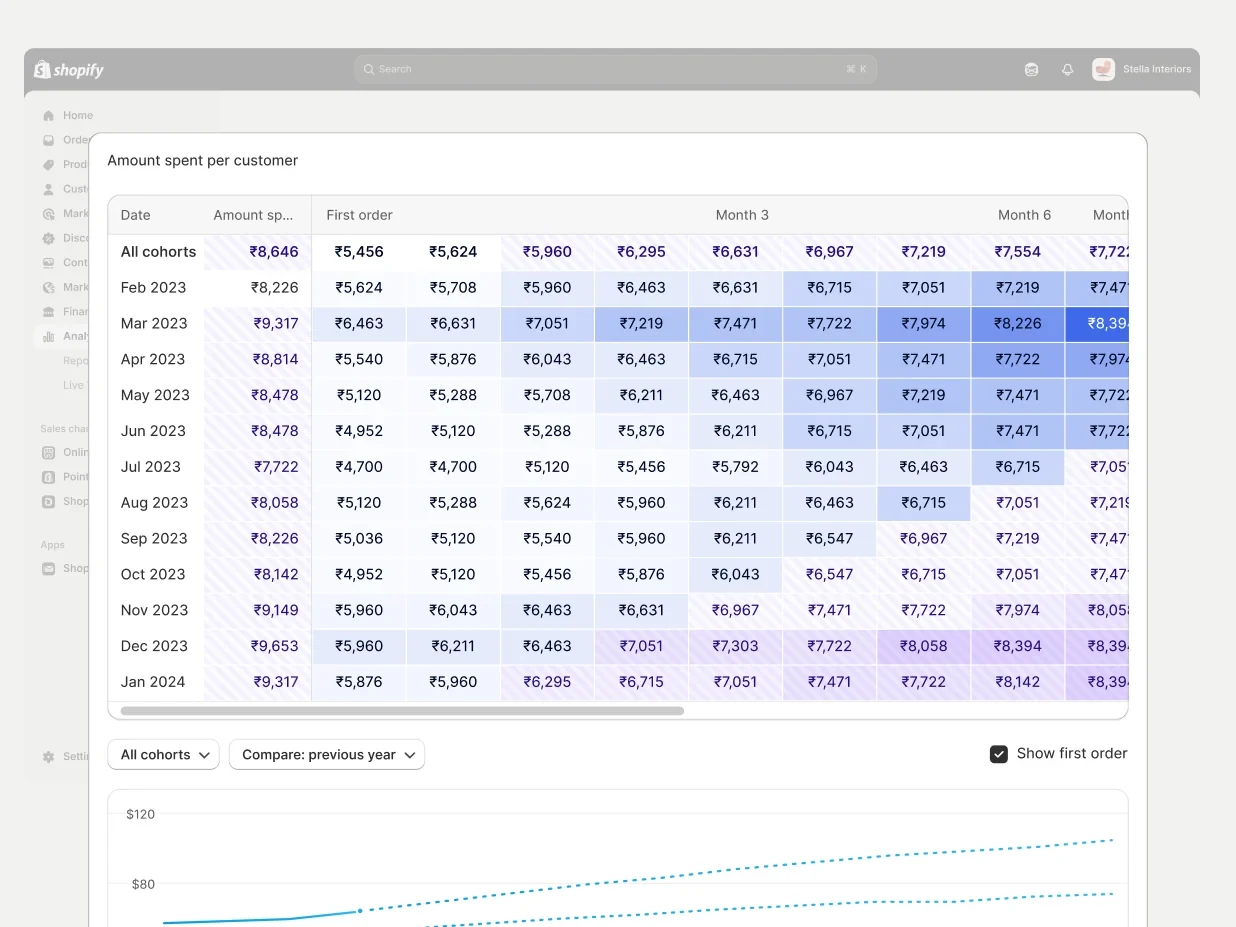
Shopify Analytics is Shopify’s built-in reporting system for tracking sales, sessions, conversion rates, customer activity, and marketing performance. Its dashboard, pre-built reports, and custom data explorations let you examine store performance across channels, products, and time periods.
What it offers
Shopify Analytics provides customizable dashboard cards, detailed commerce reports, and tools to explore specific metrics and dimensions. You can compare date ranges, segment traffic by device or referrer, track campaign performance, and monitor sales in real time through Live View.
Pricing
Shopify Analytics is available on all Shopify plans, including Basic ($39/month), Grow ($105/month), Advanced ($399/month), and Plus (starting at $2,300/month), with lower monthly rates for annual billing on eligible plans.
How to use Shopify Analytics in your CRO audit
- Establish a baseline: Review sessions, sales, conversion rate, and AOV across relevant date ranges to understand your store’s current performance.
- Identify conversion gaps: Compare traffic and conversion trends to find underperforming landing pages, products, or sales channels that need investigation.
- Segment your traffic: Compare sessions and conversion rates by device, geography, and referrer to identify weaker-performing audiences or traffic sources.
- Review product and landing-page reports: Identify high-performing pages, products with declining sales, and potential merchandising opportunities.
- Evaluate marketing performance: Use campaign and channel reports to connect traffic sources with sales, customer acquisition cost, and return on ad spend (ROAS).
Why start with Shopify Analytics?
Shopify Analytics uses data already available in your Shopify admin, giving you a baseline before you invest in additional CRO software. Once you identify where performance is weak, use heatmaps and session recordings to investigate shopper behavior on those pages and develop specific hypotheses to test.
Heatmap.com: Best for ecommerce heatmaps and revenue insights
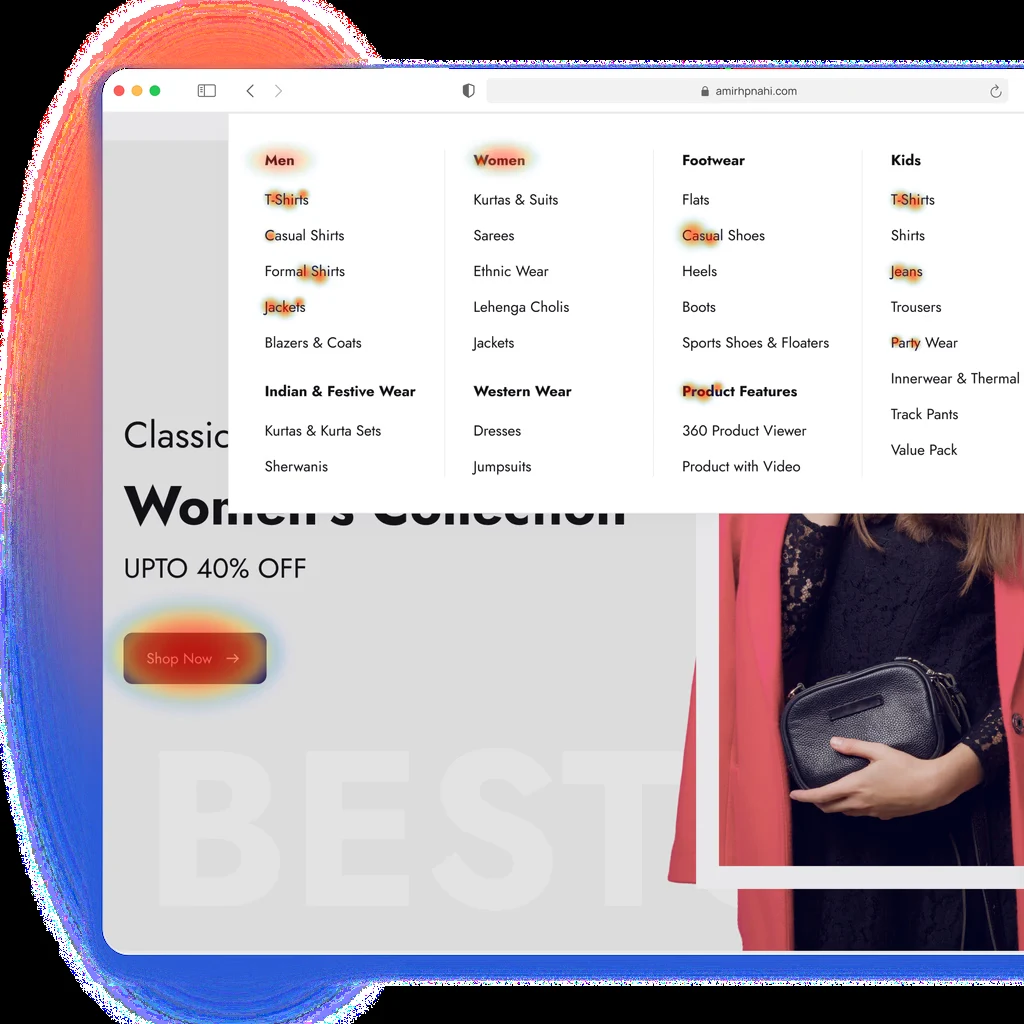
Heatmap.com is an ecommerce-focused behavior analytics platform that connects shopper interactions with revenue data. It offers heatmaps, scroll maps, session recordings, funnel analysis, and revenue tracking to help you understand how visitors interact with your pages and which interactions correlate with purchases.
The tool also integrates with ecommerce platforms such as Shopify, WooCommerce, BigCommerce, and Magento.
What it offers
Heatmap.com provides revenue-based heatmaps, session recordings, funnels, surveys, site-speed tracking, and AI-powered insights. You can review how visitors interact with popups, product information, and calls to action. These interactions can reveal whether an element attracts attention, interrupts browsing, or creates friction before checkout.
Pricing
Heatmap.com’s Launch plan costs $199 per month for stores generating under $10 million in annual revenue. The Growth plan costs $349 per month for $10 million to $25 million in annual revenue, and the Scale plan costs $699 per month for $25 million to $50 million. A 14-day free trial is available.
How to use Heatmap.com in your CRO audit
- Establish a revenue baseline: Review revenue per session, conversion rate, and AOV across relevant date ranges to identify changes in performance.
- Prioritize pages for investigation: Find high-traffic pages with weak revenue performance and investigate what may be limiting purchases.
- Inspect page elements: Use revenue-based heatmaps to examine how shoppers interact with call-to-action (CTAs), product modules, and content blocks.
- Investigate cart and checkout friction: Review funnel drop-offs and session recordings to identify potential obstacles during checkout.
- Compare devices and traffic sources: Check mobile versus desktop performance and paid versus organic traffic to locate differences in conversion efficiency.
- Turn findings into test ideas: Prioritize changes based on potential revenue impact, then use the findings to plan A/B tests for page layouts, product information, and merchandising.
Contentsquare (formerly Hotjar): Best for understanding visitor behavior
Contentsquare is a digital experience analytics platform that offers heatmaps, session replays, funnel analysis, and customer feedback to help you understand how visitors interact with your website. Heatmaps show where shoppers click, tap, and scroll, while session replays reveal the interactions that lead to conversion or cart abandonment.
What it offers
Contentsquare provides heatmaps, journey analysis, funnel reporting, surveys, error monitoring, and performance monitoring. Its zone-based heatmaps help you evaluate individual page elements, while funnel and journey analysis reveal where visitors drop off. Some plans include advanced features such as revenue-based metrics and form analysis.
Pricing
Contentsquare offers a free Experience Analytics plan with up to 200,000 monthly sessions, including heatmaps, session replays, funnels, and error and performance monitoring. The Growth plan starts at $39 per month when billed annually, with pricing and feature limits varying by plan.
Advanced capabilities, including some revenue metrics and form analysis, may require higher-tier plans. Survey products have separate pricing.
How to use Contentsquare in your CRO audit
- Review priority pages: Use heatmaps on landing pages, collection pages, and product pages to see whether shoppers interact with key calls to action (CTAs), product information, and trust signals.
- Find funnel drop-offs: Map the purchase journey to identify where visitors abandon the process, then compare results across devices and traffic sources.
- Investigate session replays: Watch sessions around drop-off points to identify confusing interactions, overlooked information, or usability issues.
- Evaluate page elements: Use zone-based heatmaps to compare engagement across content blocks and prioritize elements for further testing.
- Investigate form friction: Where form analysis is available, identify fields associated with abandonment and review related sessions to understand the problem.
- Collect customer feedback: Use surveys to learn what information shoppers need or what prevents them from completing a purchase.
- Check technical issues: Review error and performance monitoring data to identify technical problems that may interrupt the purchase journey.
Microsoft Clarity: Best for free heatmaps and session recordings
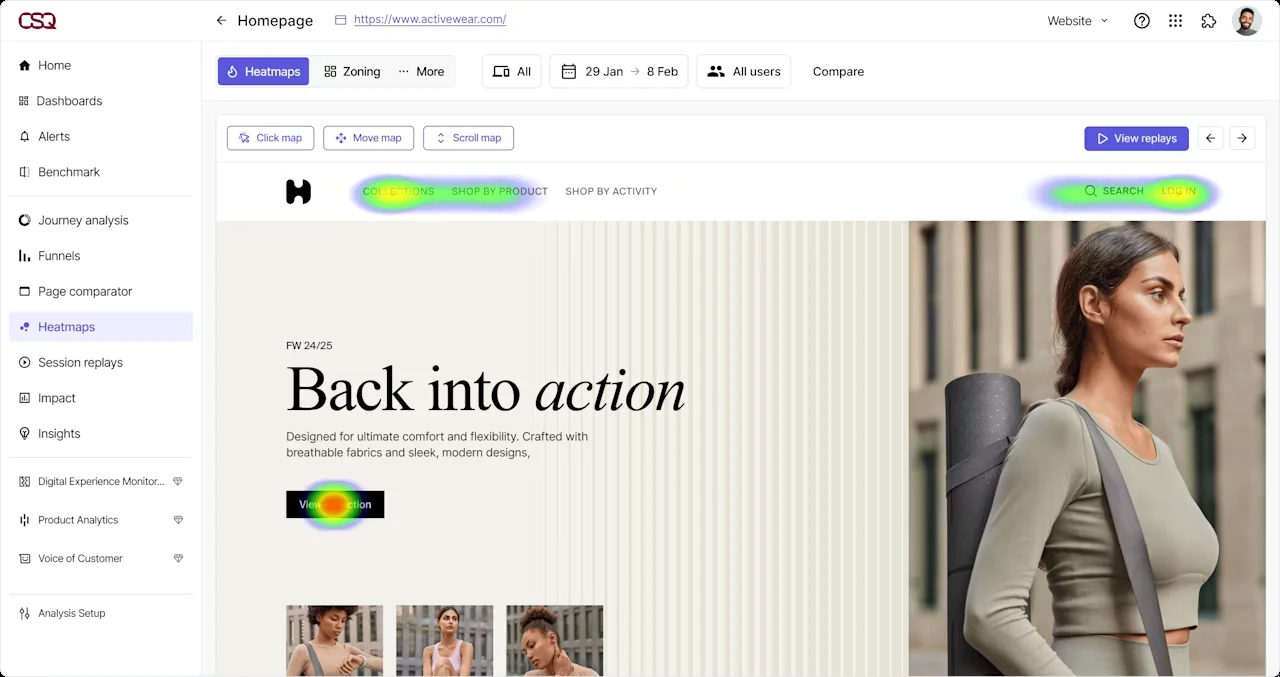
Microsoft Clarity is a free behavior analytics tool that helps you understand how visitors interact with your website through session recordings, heatmaps, and behavioral signals. It highlights patterns such as rage clicks, dead clicks, and missed interactions that can point to usability issues across your store.
What it offers
Clarity provides session recordings, click and scroll heatmaps, attention maps, and conversion heatmaps. Its behavioral signals flag potentially frustrating interactions, and segmentation filters help you analyze specific pages, devices, traffic sources, and visitor groups. You can also connect Clarity with Google Analytics 4 (GA4) to compare behavioral evidence with traffic and conversion data.
Pricing
Microsoft Clarity is free, with no traffic limits or paid upgrade required for its core features. The platform includes unlimited heatmaps, websites, and team members, making it a practical option for ecommerce teams investigating shopper behavior without adding software subscription costs.
How to use Microsoft Clarity in your CRO audit
- Analyze priority pages: Create heatmaps for landing pages, product pages, collection pages, and checkout to see where visitors click and how far they scroll.
- Identify friction signals: Investigate rage clicks, dead clicks, and repeated interactions to find confusing layouts or elements that may not work as expected.
- Review session recordings: Watch sessions from underperforming pages to understand what visitors do before abandoning a product page, cart, or form.
- Compare visitor segments: Analyze mobile versus desktop behavior and compare traffic sources to identify groups experiencing usability issues.
- Evaluate page changes: Compare heatmaps across page versions or time periods to see whether a redesign changes visitor engagement.
- Connect behavior with performance: Pair Clarity findings with GA4 traffic and conversion metrics to prioritize issues affecting important pages and visitor segments.
Lucky Orange: Best for identifying on-site friction
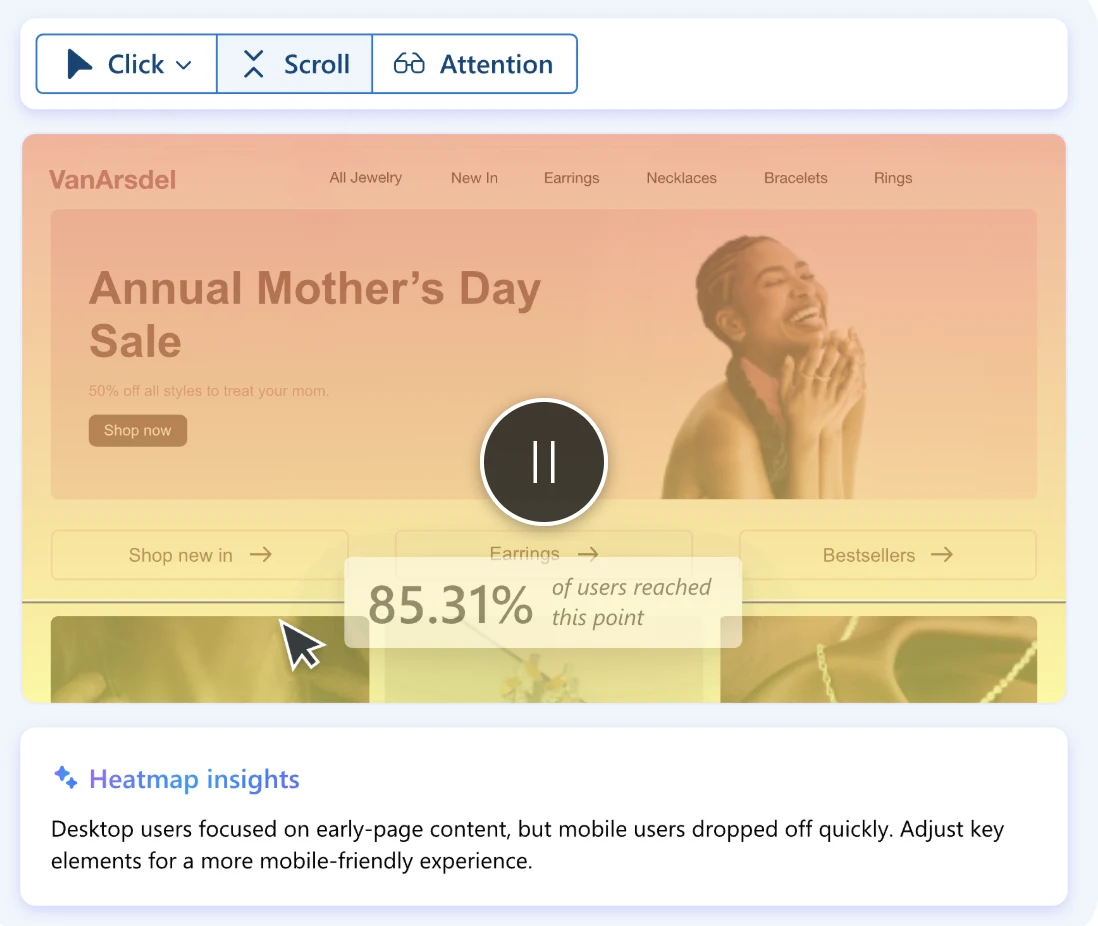
Lucky Orange is a behavior analytics and conversion optimization platform with session recordings, dynamic heatmaps, conversion funnels, surveys, and live chat. Its Discovery AI helps teams find usability issues and locate visitor sessions that provide evidence of those problems.
What it offers
Lucky Orange lets you filter recordings by device, traffic source, funnel step, and frustration signals to investigate specific visitor segments. Its dynamic heatmaps reveal how shoppers interact with page elements, and funnel reports pinpoint where visitors abandon their journey.
Form analytics helps identify problematic fields, and live visitor monitoring lets teams observe on-site activity as it happens. Surveys collect direct feedback that can help explain the behavior seen in recordings.
Pricing
Lucky Orange offers a 7-day free trial with access to all features. Paid plans start at $32 per month when billed annually for up to 3,500 monthly sessions. The Discovery AI feature is an add-on, and additional websites cost $5 per site.
How to use Lucky Orange in your CRO audit
- Identify priority issues: Use Discovery AI to identify potential friction points and review the supporting session recordings.
- Map funnel abandonment: Examine the journey from product discovery to add-to-cart, checkout, and purchase to pinpoint where visitors leave.
- Review frustrated sessions: Filter recordings by frustration signals, mobile usage, checkout abandonment, or traffic source to investigate recurring problems.
- Inspect forms and checkout: Look for abandoned fields, repeated corrections, validation errors, and unclear shipping or payment steps.
- Analyze dynamic heatmaps: Check whether shoppers interact with product details, calls to action (CTAs), navigation, and trust signals, including elements inside dropdowns and pop-ups.
- Collect visitor feedback: Use surveys on product pages or checkout to understand purchase barriers, then review linked recordings for context.
- Prioritize fixes: Rank issues by frequency, funnel stage, and potential revenue impact before planning follow-up tests.
Google Analytics 4: Best for funnel and conversion analysis
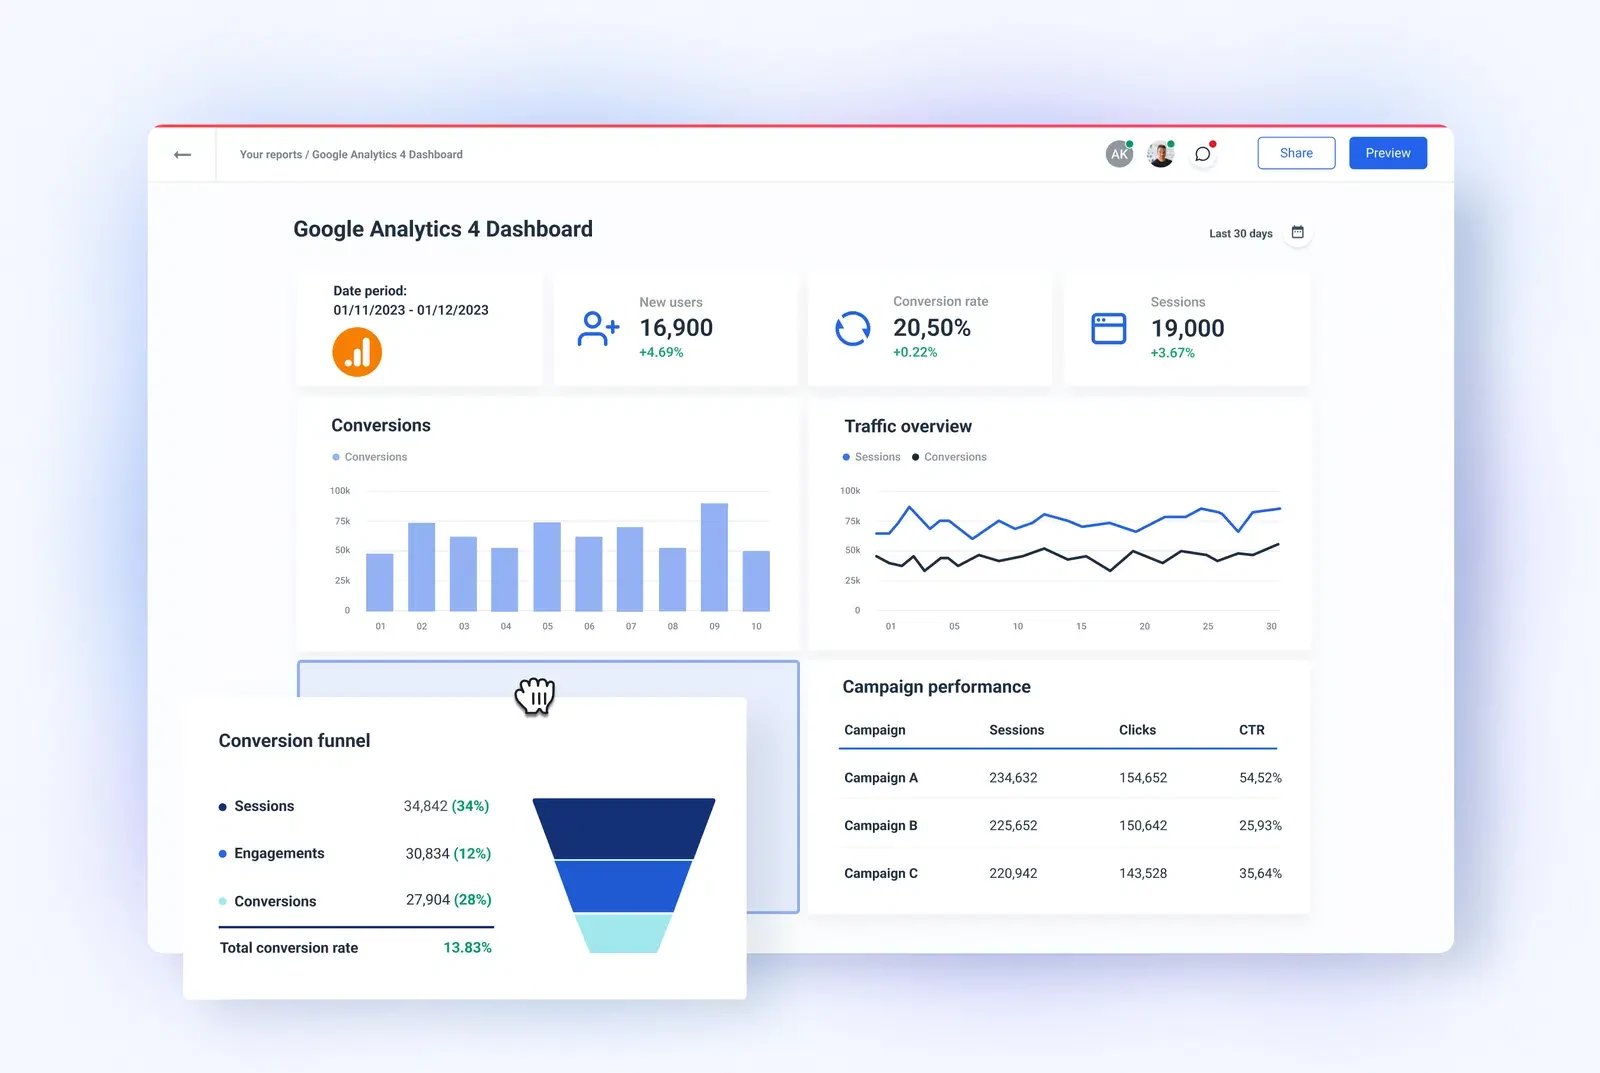
Google Analytics 4 (GA4) is Google's event-based analytics platform for websites and apps. It tracks traffic sources, landing-page performance, user engagement, and conversion events, with funnel exploration and segmentation reports to show how different audiences move through your site.
GA4 helps you identify where conversion problems occur by page, device, traffic source, or funnel step. It shows where visitors drop off, giving you a starting point for further investigation with behavioral analytics tools such as Microsoft Clarity or Contentsquare.
What it offers
GA4 uses events to measure user interactions, including page views, add-to-cart actions, checkout starts, and purchases. Its reporting capabilities include:
- Traffic acquisition: Compare organic, paid, referral, email, and social traffic.
- Landing-page analysis: Evaluate which entry pages lead to engagement and conversions.
- Conversion tracking: Measure purchases, sign-ups, form submissions, and other important actions.
- Funnel exploration: Identify the steps where visitors abandon a purchase or lead journey.
- Audience segmentation: Compare conversion behavior by device, geography, campaign, and user type.
- Platform integrations: Connect Google Ads and Search Console to relate acquisition performance to user behavior.
Use these reports to prioritize landing page optimization by identifying pages with high traffic, weak engagement, or low progression to the next step in the funnel.
Pricing
Google Analytics 4 is free for standard website and app analytics. Google Analytics 360 is the paid enterprise offering for organizations that need additional capabilities and enterprise-level support.
How to use Google Analytics 4 in your CRO audit
- Verify tracking: Check that your GA4 property and Google tag collect data correctly, and confirm that key ecommerce events are firing.
- Establish a baseline: Review sessions, conversion rate, purchases, and revenue across relevant date ranges to identify performance changes.
- Compare acquisition channels: Find channels that generate traffic but contribute fewer conversions, then investigate their landing pages and audience quality.
- Audit landing pages: Compare engagement, conversion rate, and revenue to identify pages that attract visitors but fail to move them toward purchase.
- Build a conversion funnel: Map product views, add-to-cart actions, checkout starts, and purchases to locate the largest drop-offs.
- Segment funnel performance: Compare devices, campaigns, and new versus returning visitors to determine which groups experience the biggest conversion gaps.
- Develop investigation priorities: Use the data to identify the pages and audiences that need heatmap analysis, session recordings, or customer feedback.
PostHog: Best for event-based funnel and journey analysis
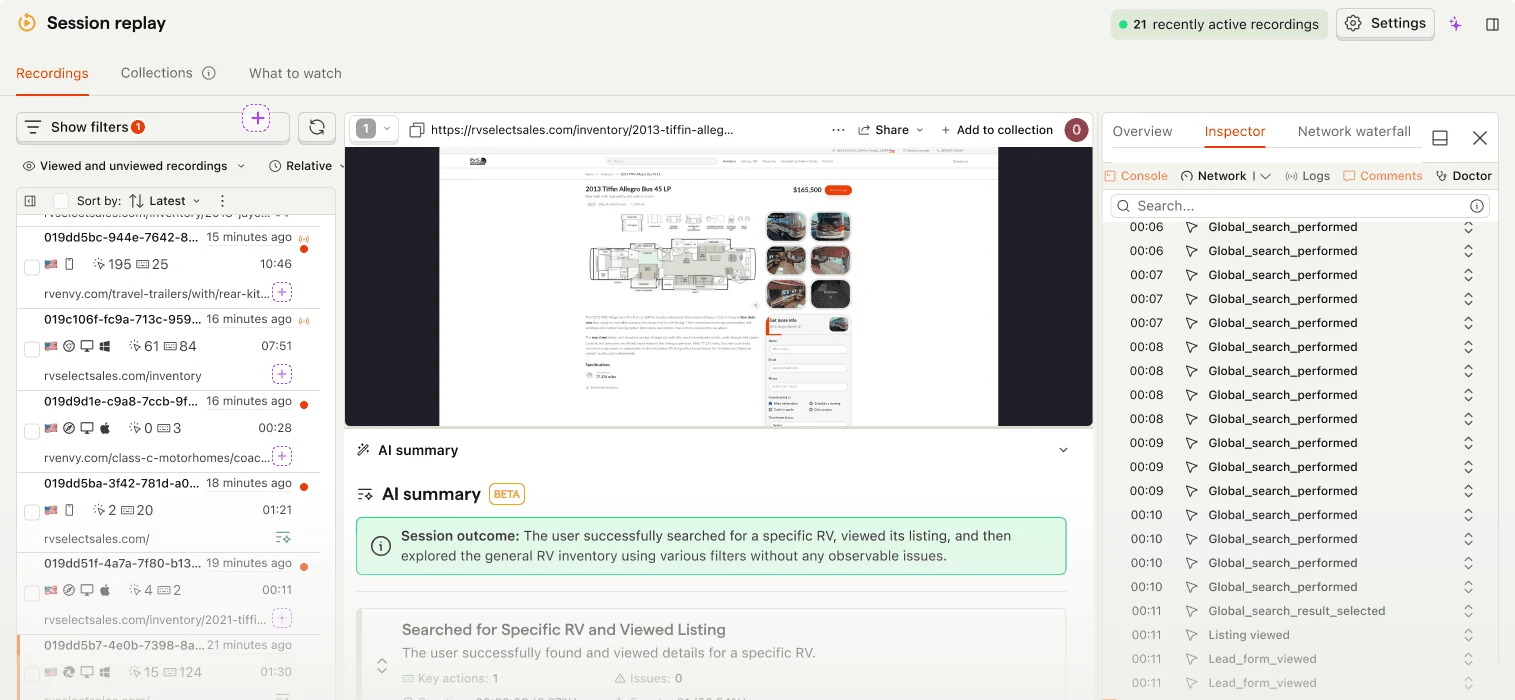
PostHog is a product analytics platform that provides event tracking, funnels, user paths, retention analysis, and session replay. It helps teams investigate conversion drop-offs across detailed user journeys, especially when they need to connect specific actions with the behavior behind them.
What it offers
PostHog automatically captures page views, clicks, and form submissions, along with custom events and properties for more precise tracking. Its main capabilities include:
- Funnel analysis: Identify where shoppers abandon a sequence of actions and compare conversion rates between steps.
- User paths: Explore the routes visitors take before or after a key action.
- Session replay: Review recorded sessions linked to funnel steps to investigate the behavior behind conversion gaps.
- Segmentation and retention: Compare behavior across user groups and track repeat usage over time.
- Experiments and feature flags: Test product changes and measure their effects on conversion, activation, or retention.
- Product analytics: Combine event-level behavior with funnel analysis to identify where users drop off and which interactions precede conversion.
Pricing
PostHog offers a free tier with 1 million analytics events and 5,000 session recordings per month, alongside allowances for other products. Paid usage follows a pay-as-you-go model, with pricing based on the products used and the volume of activity.
Product Analytics starts at $0.00005 per event beyond the free allowance. You can set billing limits to control usage costs.
How to use PostHog in your CRO audit
- Validate event tracking: Confirm that page views, product views, add-to-cart actions, checkout starts, and purchases are captured consistently. Add custom events where autocapture misses important interactions.
- Build a conversion funnel: Map the journey from a landing page or product view through checkout and purchase to identify where visitors drop off.
- Investigate funnel drop-offs: Review the steps with the largest losses and compare conversion rates across relevant time periods.
- Compare visitor segments: Analyze funnel performance by device, traffic source, or new versus returning visitors to find groups experiencing conversion friction.
- Explore user paths: Look for unexpected detours, repeated actions, or missing next steps that could indicate navigation or usability issues.
- Review session recordings: Open recordings from drop-off points to investigate errors, confusing interfaces, or other conversion barriers.
- Develop and validate test ideas: Use recurring patterns in event data and recordings to form hypotheses, then use experiments to measure whether changes improve conversion.
ABConvert: Best for validating CRO improvements with A/B tests
ABConvert is a Shopify-native A/B testing platform that helps ecommerce teams validate changes identified during a CRO audit before rolling them out across their store. You can test changes across the buying journey, from landing pages and product pages to pricing, shipping, offers, themes, templates, and checkout.
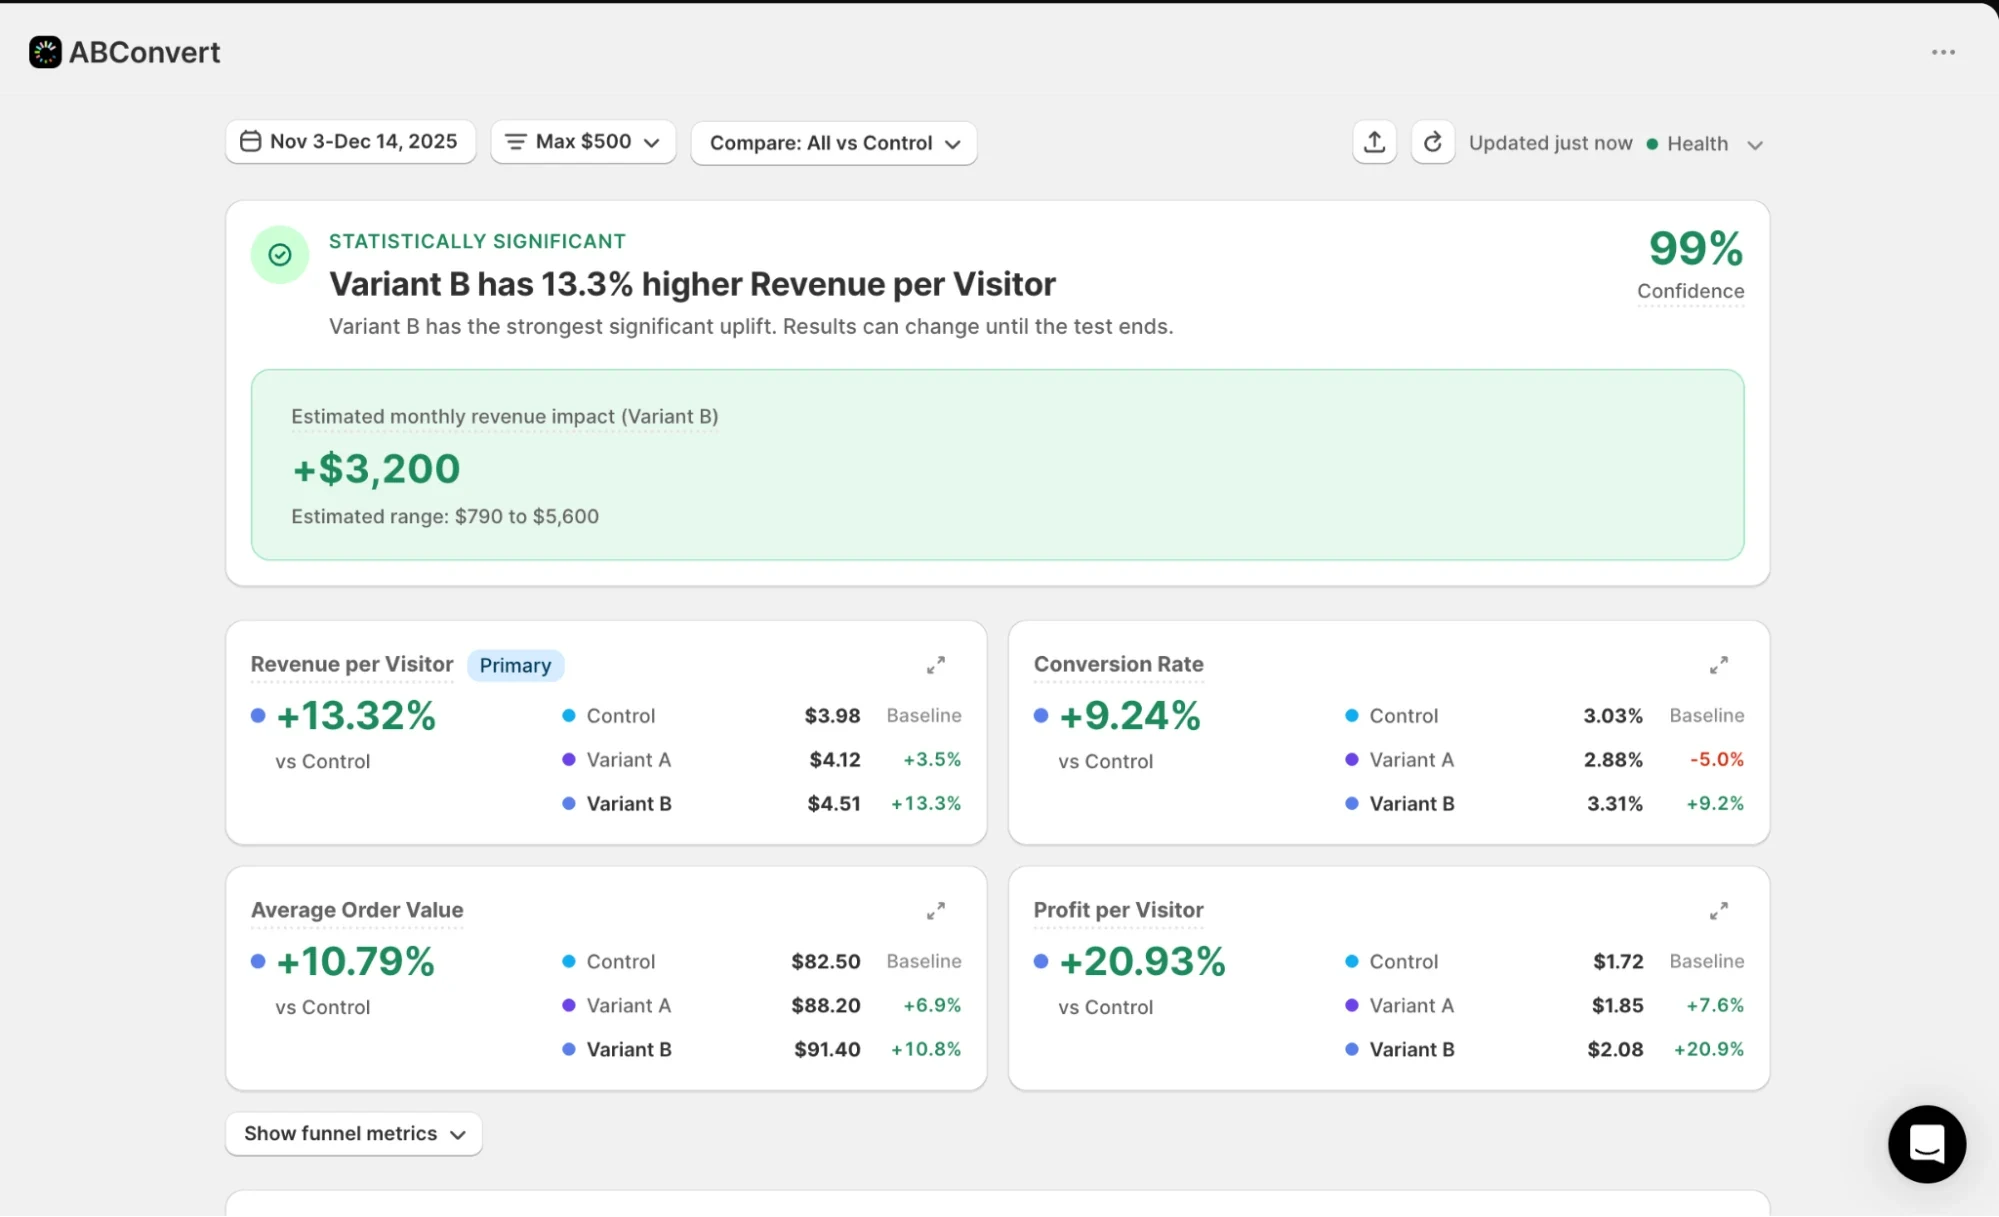
ABConvert helps you measure whether a proposed change improves conversion, average order value (AOV), revenue per visitor (RPV), or profit. This is especially useful when a change involves a trade-off, such as raising prices to improve margins or increasing a free-shipping threshold to lift order value.
What it offers
ABConvert supports 8 test types, with no-code options for common storefront changes and more advanced controls for specific use cases:
- Landing and product pages: Test headlines, images, calls to action (CTAs), content, and page layouts using the visual editor or URL redirects.
- Themes and templates: Compare alternative page layouts or storefront designs before applying them to your wider store.
- Pricing: Test product prices to evaluate their effect on conversion, revenue, and profit.
- Shipping: Compare shipping rates, labels, and free-shipping thresholds to find a balance between checkout completion and order value.
- Offers: Compare discounts, bundles, and promotional structures while accounting for their impact on margins.
- Checkout: Test supported checkout flows, including delivery and payment options, checkout content, and upsells. Some checkout customizations require Shopify Plus.
ABConvert lets you conduct split tests across different storefront experiences to measure how changes affect conversion rate, RPV, and AOV. You can also target tests by country, device, traffic source, and new versus returning visitors, and compare their results through analytics reports.
Pricing
ABConvert starts at $99/month for the Starter plan, which includes up to 1,000 test orders per month. Annual billing lowers the starting price to $74/month. A 14-day free trial is available. Higher plans include larger test-order allowances.
How to use ABConvert in your CRO audit
- Turn findings into test hypotheses: Use insights from the analytics, heatmaps, and session recordings you looked at using the other CRO audit tools to define the problem, the change you want to test, and the metric that will measure its impact.
- Prioritize high-impact opportunities: Start with pages or buying-journey steps that have meaningful traffic and a clear conversion, revenue, or margin opportunity.
- Test page changes: Compare product images, headlines, calls to action, trust signals, and section layouts to find which version improves performance.
- Choose the right test type: Match your hypothesis to the appropriate experiment, whether that’s a URL redirect, template, theme, shipping, price, or cart transformation test.
- Set clear success metrics: Decide how you’ll measure impact before launching, using metrics such as conversion rate, revenue per visitor, average order value, and profit per visitor.
- Check the full customer journey: Preview each version across the storefront, cart, and checkout before launch to catch implementation issues that could affect the visitor experience or test data.
- Evaluate results before rollout: Compare performance across variants and collect sufficient data to make an informed decision before implementing a change.
Ready to validate your CRO audit findings? Get started with a 14-day free trial of ABConvert.
03How to choose the right CRO audit tool stack
Your CRO audit tool stack should reflect your store’s existing analytics setup, audit priorities, traffic volume, technical resources, and budget. Start with the data you already collect, and add tools when you need insights your current setup can’t provide.
Use these questions to decide which A/B testing tools should be a part of your CRO stack:
- Where are shoppers dropping off? Use Google Analytics 4 (GA4) and Shopify Analytics to identify funnel drop-offs, underperforming landing pages, and changes in conversion trends.
- How are visitors interacting with pages? Use Heatmap.com, Hotjar, Microsoft Clarity, or Lucky Orange to investigate clicks, scrolling behavior, and potential usability issues on priority pages.
- What do user journeys and event data reveal? Use PostHog to analyze event funnels and user paths when you need more detailed journey analysis and have the relevant events instrumented.
- Did the proposed change actually improve performance? Use ABConvert to run A/B tests and measure the impact of changes on conversion rate and relevant revenue metrics.
You may not need every tool in each category. If two tools provide similar insights, compare their reporting capabilities, tracking requirements, and costs before adding them to your stack. This keeps your audit focused and reduces overlapping software spend.
04How to conduct a CRO audit
A CRO audit helps you identify underperforming pages, investigate shopper behavior, and develop test ideas that address specific conversion gaps.
Follow these steps to turn your audit findings into experiments:
- Identify gaps and opportunities: Use Google Analytics 4 (GA4) and Shopify Analytics to find underperforming landing pages, funnel drop-offs, and conversion gaps.
- Investigate page interactions: Use heatmaps and session recordings from Hotjar, Microsoft Clarity, Lucky Orange, or Heatmap.com to understand how shoppers interact with your pages.
- Analyze user journeys: Use PostHog to examine both page interactions and funnel behavior, connecting shopper actions with drop-off points.
- Build your campaign direction: Use your findings to identify the pages and elements that need improvement, and develop relevant campaign and testing ideas.
- Prioritize test ideas: Use behavioral insights to decide whether to test buy box placement, update FAQs, or change product image layouts.
- Run an A/B test: Use ABConvert to test your proposed changes and measure their impact on conversion performance.
- Measure the outcome: Compare conversion rate, AOV, RPV, and profit margin where relevant to assess the results.
- Roll out winning changes: Implement changes that deliver positive results, document the learnings, and use them to inform future CRO experiments.
05Frequently asked questions
What is the best free tool for a CRO audit?
Microsoft Clarity is a strong free tool for investigating shopper behavior through heatmaps and session recordings. Google Analytics 4 (GA4) and Shopify Analytics help you identify funnel drop-offs and underperforming pages. Using these tools together gives you a useful starting point for your audit.
Can you conduct a CRO audit without paid tools?
Yes, you can conduct a CRO audit without paid tools with GA4, Shopify Analytics, and Microsoft Clarity. Use analytics to identify conversion gaps, and review heatmaps and session recordings to investigate potential usability issues. Use these findings to prioritize improvements before investing in paid experimentation tools.
What is the difference between GA4 and Shopify Analytics?
The difference between GA4 and Shopify Analytics lies in their reporting focus.
GA4 helps you analyze traffic sources, events, user journeys, and conversion funnels, while Shopify Analytics provides store-focused reporting on sales, conversion rates, and average order value (AOV).
Use both to connect shopper behavior with commercial performance.
Which tools show why visitors aren't converting?
Hotjar, Microsoft Clarity, Lucky Orange, and Heatmap.com help you investigate why visitors may not be converting through heatmaps and behavioral insights. PostHog supports deeper analysis of user journeys and event funnels.
Review these insights with GA4 and Shopify Analytics to identify potential causes of conversion drop-offs.
Which heatmap tool is best for ecommerce?
The best heatmap tool for ecommerce depends on your audit requirements:
- Heatmap.com offers ecommerce-focused behavioral and revenue insights.
- Hotjar combines heatmaps with customer feedback.
- Microsoft Clarity provides free heatmaps and session recordings.
- Lucky Orange offers dynamic heatmaps and session recordings.
Choose based on the insights you need and your existing analytics setup.
How do you validate findings from a CRO audit?
Validate CRO audit findings by testing proposed changes through A/B experiments. Use ABConvert to compare a control version with multivariate testing and evaluate conversion rate, AOV, RPV, and profit margin to determine which version performs better.
Use the results to decide whether to implement the change or investigate another hypothesis.
06Ready for your CRO audit?
A CRO audit helps you understand which touchpoints across your customer journey are affecting conversions and how you can improve your store to drive better results.
ABConvert’s internal CRO audit helps you uncover opportunities to experiment, test potential improvements, and make data-informed decisions about what to change.
Get your free CRO audit
Start your 14-day ABConvert trial



