

When Shopify sales drop, stop guessing: generate an insight report with Claude
Learn how to install ABConvert's Shopify Insight Report skill in Claude, connect a Shopify store, and turn a sales or conversion drop into a report you can verify.
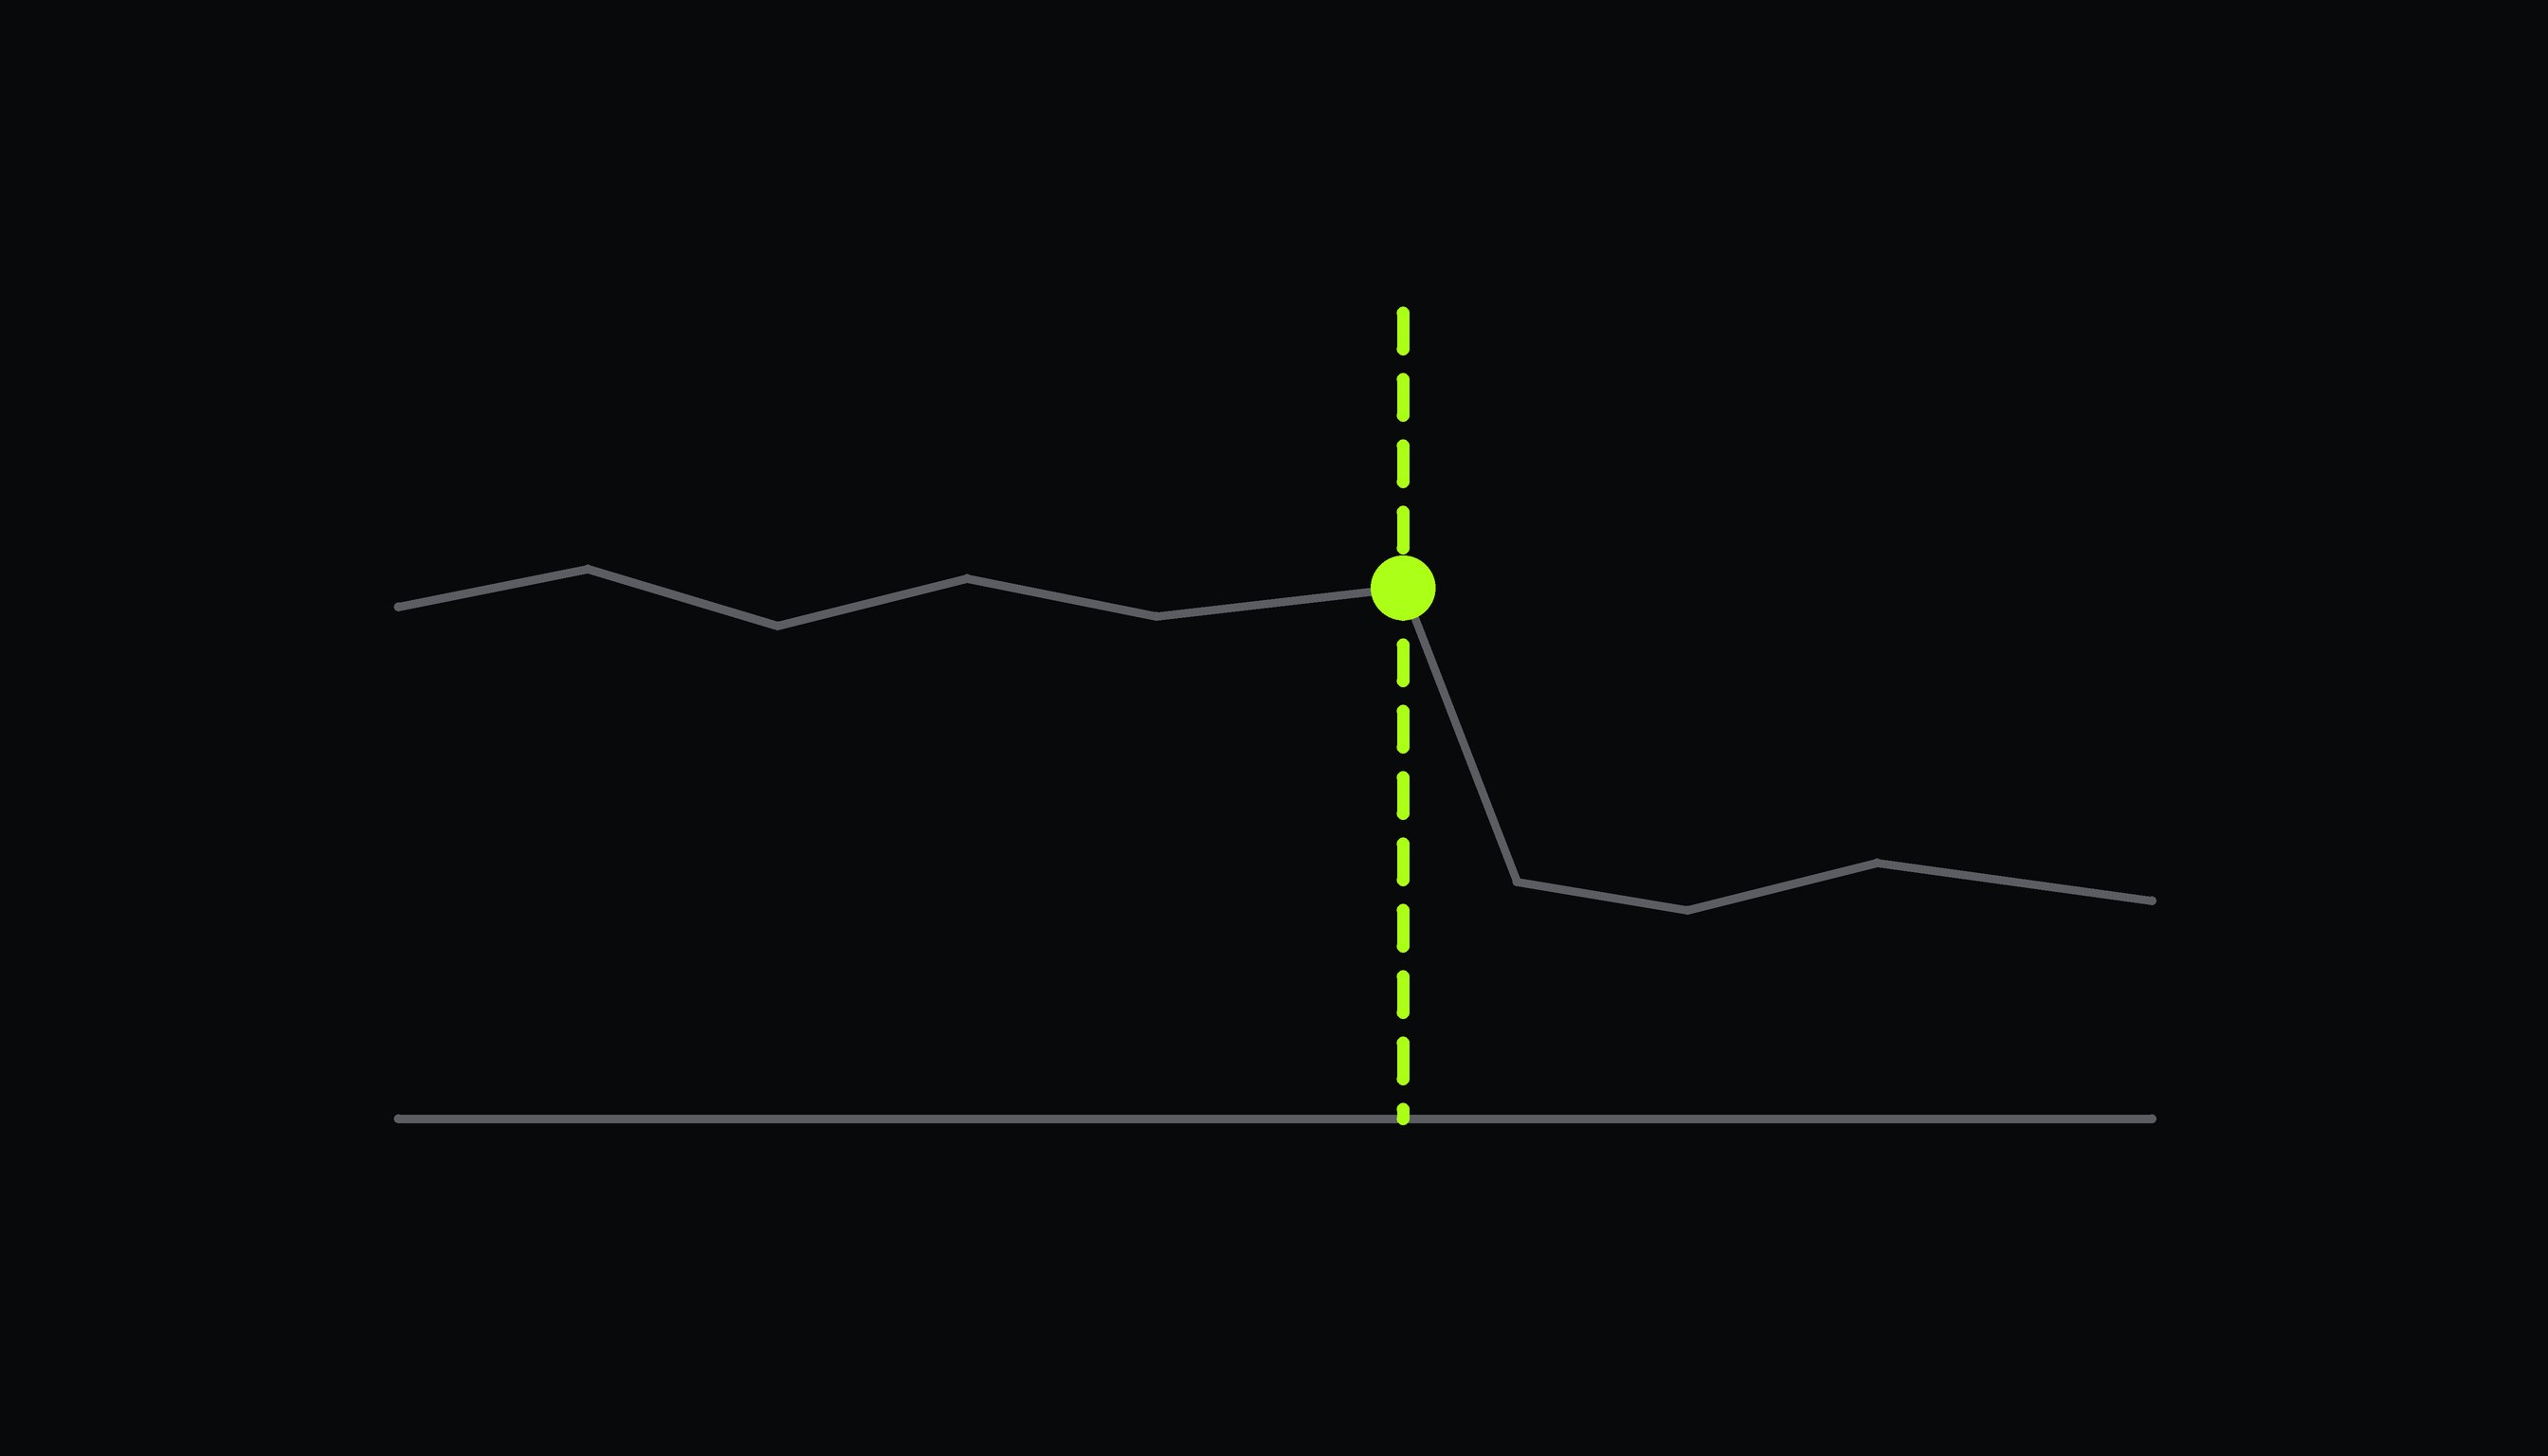
A Shopify store can look fine on Monday and feel broken by Friday. Sales are down. Conversion rate has slipped. Traffic is still coming in, but fewer people reach checkout.
The usual response is a messy list of theories: the new theme, a discount change, a shipping update, an app, paid traffic quality, or something in checkout. The problem is not a lack of opinions. It is finding the point where the numbers changed and testing whether the suspected event lines up with it.
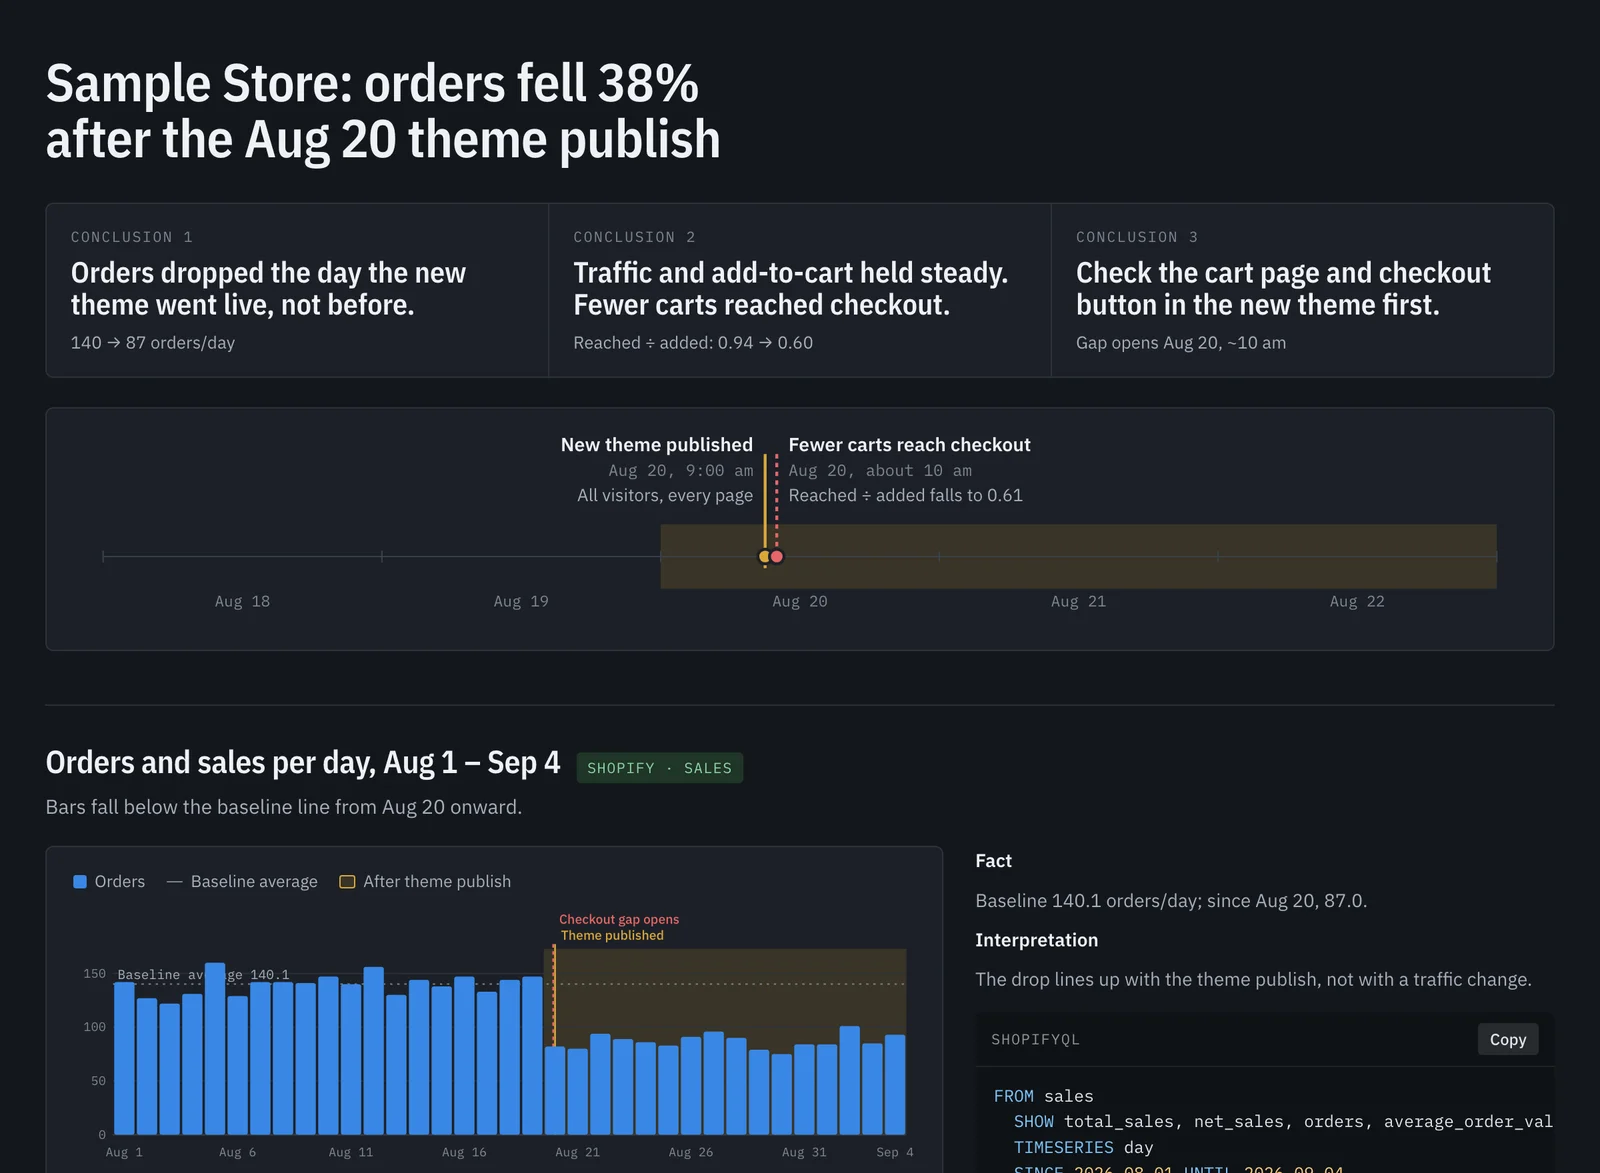
ABConvert's Shopify Insight Report skill helps you do that work with Claude and your store's own Shopify analytics. Give it a question such as "conversion rate dropped about 30% in the last month," and it produces a one-page HTML report with conclusions, a timeline, charts, and the ShopifyQL queries behind the analysis.
That last part matters. You can review the logic and re-run the numbers in Shopify Analytics instead of treating an AI answer as a black box.
01When a sales drop is worth investigating
Use the Shopify Insight Report skill when a meaningful store metric changes and you need a faster starting point for investigation.
Examples:
- Sales fell after a theme publish.
- Conversion rate dropped over the last 30 days.
- Revenue is flat even though sessions increased.
- Add-to-cart rate changed after a pricing or promotion update.
- Checkout completion worsened after a shipping, checkout, app, campaign, migration, or A/B test change.
The skill investigates the timing of the change, the funnel step or segment that moved, and whether the event you suspect could reasonably explain it. The output is designed to answer a practical operator question: what changed, when did it start, and where should we look next?
02Before you start
Setup takes about five minutes. You need two things:
- The Shopify Insight Report skill installed in Claude
- A Shopify MCP connector connected to the store you want to analyze
You may need to request access to the store during connector setup. If you are working with a client or another team, ask for the minimum access needed for analytics and reporting rather than broader store permissions.
03Step 1: add the skill to Claude
Get the skill ZIP here. It's free:
Then add it to Claude under Settings → Customize → Skills. Claude needs a plan with code execution enabled for this workflow.
04Step 2: connect Shopify MCP to the right store
Connect Shopify MCP under Settings → Customize → Connectors, and choose the store carefully. A report is only useful when it is looking at the same store and the same date range as the issue you are trying to understand.
If Claude asks you to approve or request store access, complete that step before starting the analysis. The skill is built for analysis, not store changes: it does not use the report workflow to modify your Shopify store.
05Step 3: ask the question with the context you have
You can ask a simple question and let the skill begin from there. It becomes more useful when you include two pieces of context:
- Observation: What metric changed, in which direction, and over what period?
- Event: What changed during that period?
For example:
Our conversion rate dropped about 30% over the last 30 days. We published a new theme during that period. Can you analyze the store and tell me what changed, when it started, and whether the theme update is a likely cause?
Other useful prompts:
Sales have been down for the last two weeks. We introduced free shipping over a higher order threshold on September 10. Can you identify when the decline began and whether add-to-cart, checkout, or traffic quality changed first?
Sessions are up month over month, but revenue per visitor is down. We ran a new discount campaign and changed several product prices. Please investigate the funnel and compare the period before and after the changes.
Checkout completion dropped after we installed a new app. Find the point when the metric moved, which customer or traffic segments were affected, and the next checks we should run.
You do not need perfect context. Start with the metric and time range if that is all you have. Adding the suspected event gives the analysis a concrete hypothesis to evaluate instead of making it hunt through every possible store change.
06Step 4: read the report like an operator
The report should give you three things at the top:
- The main conclusions: what changed and where the evidence points.
- A timeline: when the metric broke or shifted.
- Charts and ShopifyQL queries: the underlying analysis for each question.
Use the conclusion to decide the next action, but do not stop there. Check the chart timing against your own release log, campaign history, pricing changes, shipping settings, and app installations. If the report suggests a checkout problem, verify the affected device, channel, or customer segment before rolling back anything.
A good analysis narrows the next decision. It does not give you permission to change five things at once.
07Checklist for a report you can trust
Before you ask, and before you act on the answer:
- Use a specific comparison window. "Last 30 days" is useful, but "September 1–30 compared with August 1–31" is better when you know the dates.
- Name the suspected event: theme publish dates, price changes, discount launches, shipping-threshold updates, campaign starts, and app installs help connect the data to real store activity.
- Ask for the business impact, not only the metric. If you are testing an offer or pricing change, ask about revenue per visitor, AOV, discount cost, and margin alongside conversion rate.
- Treat the report as evidence, not a verdict. Correlation can point you in the right direction, but a timeline alone does not prove causation.
Our guide to optimizing your storefront before scaling traffic covers which commercial metrics to watch. When the report points at a likely cause, test the fix before you roll it out to every visitor.
08Turn a sales drop into a decision
A sales or conversion drop is expensive when the team spends a week debating causes. The Shopify Insight Report skill gives you a faster, more auditable starting point: find the timing, isolate the funnel movement, and compare the evidence with what changed in the store.
That is how a vague "sales are down" question becomes a decision you can act on.
Find out what changed in your store
Find the day your numbers changed and whether your last change caused it, from your own Shopify data. Free, about five minutes to set up.
Download the skill →